Visualising SIFT descriptors

Having worked on a few computer vision projects at work recently I've been interested in trying to understand what the computer is seeing. A lot of image processing algorithms involve putting the image through filters, or transforms, or extracting local descriptions of portions of the image. Often these are modelled around what the human vision system is understood to be doing, but of course our brain hides this low-levelling processing from us. It seems really interesting to try and visualise some of the intermediate steps of these algorithms to try and get a better understanding of how the computer is interpreting an image.
Of course it's nothing new, computer vision papers explaining or describing algorithms often tend to contain interesting visualisations (just try searching for eigenfaces or HOG pedestrian detection). I also came across a few really nice examples of people specifically trying to visualise (or reconstruct from) image features including: visualisation of HOG features, and image reconstruction from SIFT descriptors, both produce some fantastic and interesting images.
Visualising SIFT
The Scale Invariant Feature Transform is a commonly used method for detecting and describing local 'features' in an image, for a good description of what it is and how it works see the VLFeat API documentation. Basically SIFT produces features in the image that are local points of likely interest and distinctiveness, these are described by descriptors which take a small patch of pixels and compute local histograms of intensity gradients. I've used these descriptors several times for detecting and matching objects in scenes before, and have always wanted to better understand what the computer is seeing, and what it's giving importance to. Typically SIFT descriptors can be visualised as boxes with many arrows, which do give a hint of what the underlying algorithm is producing, but I wanted to try and produce something a little more visually pleasing (if less accurate).
I came up with a simple visualisation model for a SIFT descriptor. The descriptor is a 128 element vector representing the bins of a histogram of the local intensity gradients in an image over 16 patches around the keypoint. An example of my representation for a few keypoints is shown below:
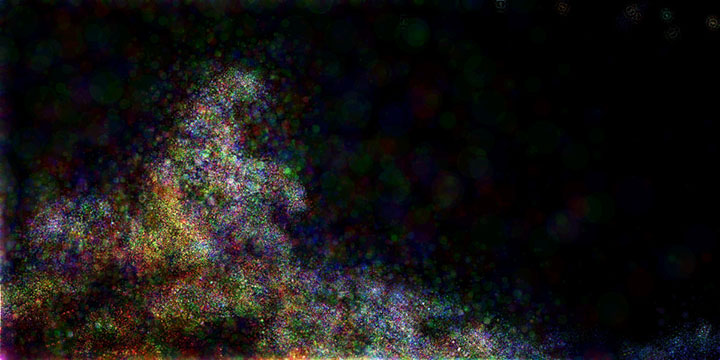
Using OpenCV (in Python) to do the SIFT detection 1. There is a good explanation of the slightly confusing OpenCV code for the SIFT keypoints here. and descriptions I placed descriptor visualisations into a blank image (scaled and rotated appropriately) and slowly saw some of the original structure of the image reappear in a ghostly form.
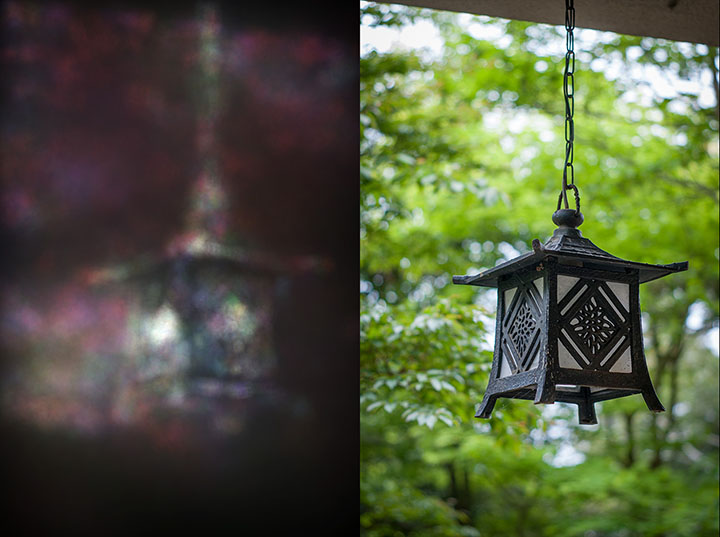
The colour in the images comes from doing feature detection in the red, green, and blue channels and adding appropriately coloured keypoints to the image. It's surprising just how much of the original details of the image begins to reappear, and it's also interesting to see what the SIFT algorithm pays attention to in the image and what it doesn't, (for example it has no interest in EVE in the frame from Wall-E above, she's just too sleek, uniform and smooth I guess).
The current algorithm is written in Python, and is painfully slow, so rendering short frames of video is fun, but takes a long time (I guess I need to look into how to use Cython, or learn C++...). The shimmering ghostly movement of rendered motion is particularly nice (and would be better if I could render it at higher resolution!)
- Previous: Abstract landscapes in Blender
- Next: DNA Lamp